In most of my data visualizations I like to add actions to help the reader to focus on what they want to see.
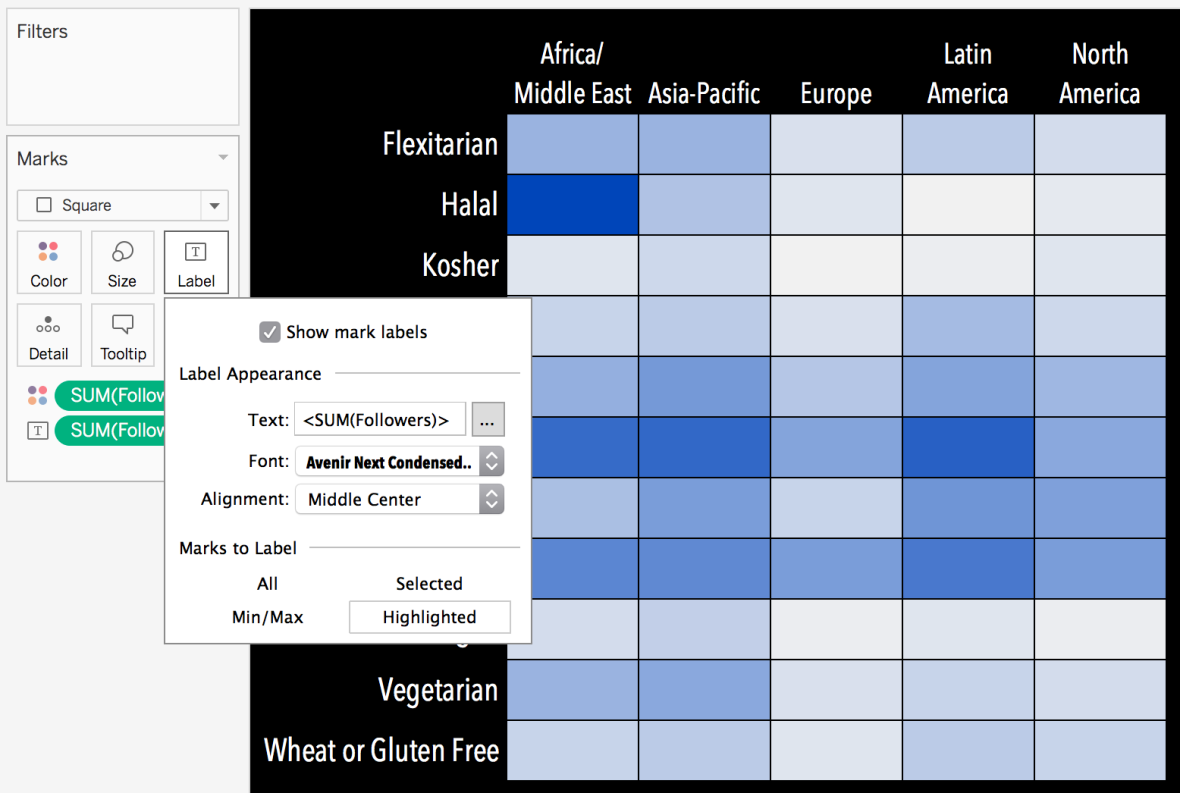
In this week’s #makeovermonday I went with a highlight table which I believe is the easiest way to make a table visually engaging. On my mind, if you need to deliver a table, make it a highlight table! And to make this highlight table pop even more I’ve added a simple hover action that not only illuminates the row/column/cell, but also displays the value that the color represents. Here is how it looks:
The tricky here in Tableau is to format your Labels card to show the labels only when Highlighted:
After that I decided to follow Nielsen’s design from the document where the original chart was posted. And if there is something I LOVE is to apply a good design to my vizzes. You can check the final version here:
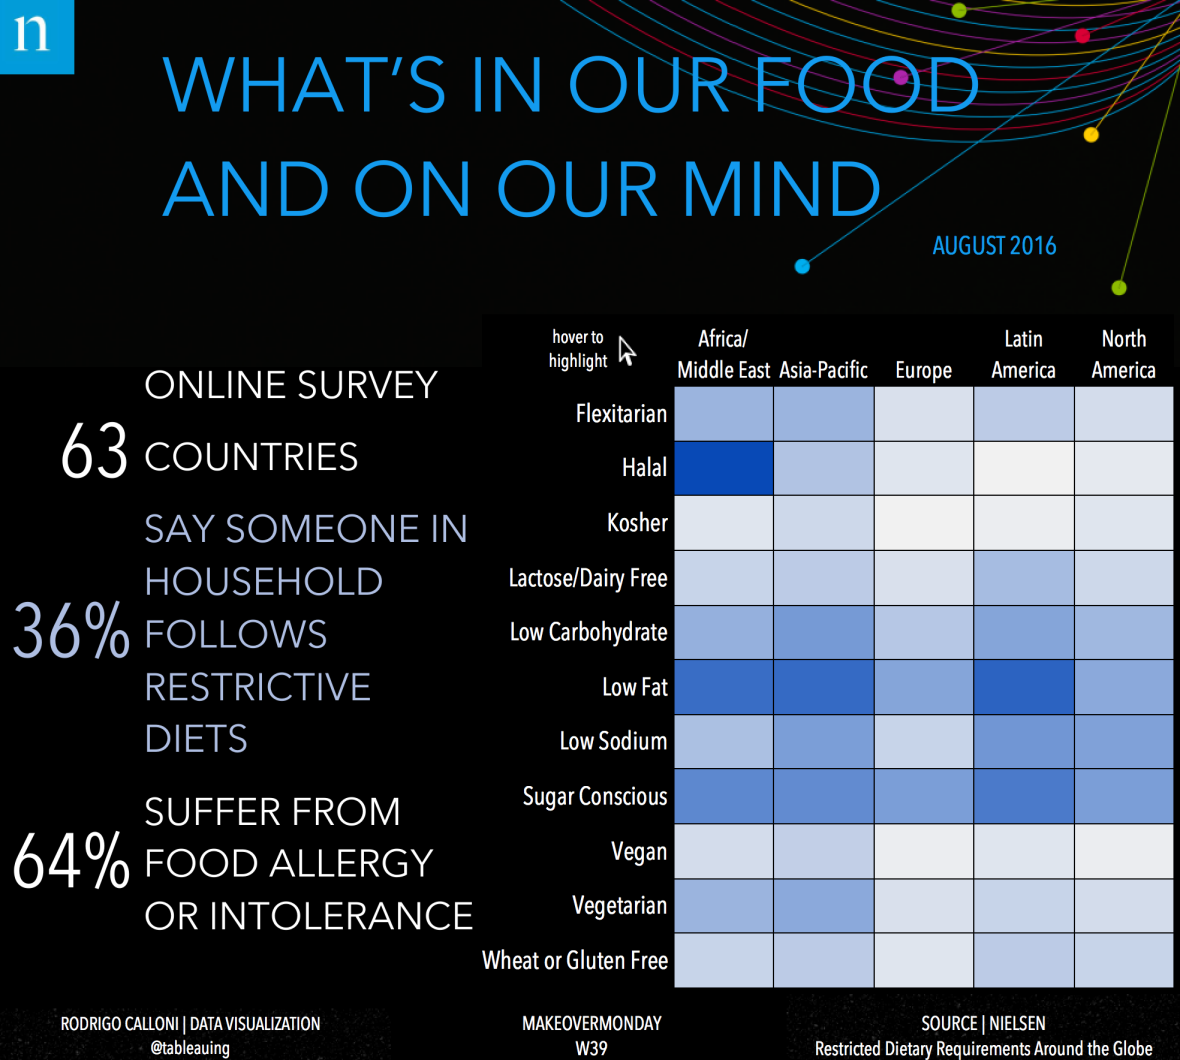
I hope you can follow these simple steps to make a simple table WOW your audiences!
