Everyday at my workplace we held a meeting that aims to define strategies to be taken during the course of the day. Data plays a key role in this half-hour encounter and for that we are working to build a set of dashboards that will allow quick decisions to be taken based on the insights they will produce.
We have 5 big screen TVs on this meeting room and the goal is to fill each one of them with the data and information needed to define the strategies. Luckily we have Tableau as an institutional BI tool so it is being pretty interesting developing such tools. Also we are forming a data analytics team and it is very exciting for me to be part of the team and share experiences and ideas with these very talented data people.
In one of the screens we are planning to have a set of dashboards that will rotate every 10/15 seconds, displaying the “yesterday” performance of each “product” so we can answer the simplest business question: Did we do well yesterday? But… rotating dashboards within a period of time is not really a feature available on Tableau Desktop or Tableau Server. Then…
Well, then I had a revelation… While walking the corridors of the institution, “reveal” came to me. And it is this reveal I will be talking about here… reveal.js
To summarize, reveal,js is a javascript library that allows creating slides and presentations. The best example I know is the one from The Data Duo in the DC TUG last year. By scrolling through the slides you will find Tableau dashboards loading live and with full interactivity.
I could download the presentation and learn from it but in the process I found that the creator of reveal.js opened a service called slides.com which allows you to create and host your slide decks. And the best, it is free service!
Once you open your account you are ready to start creating a presentation:

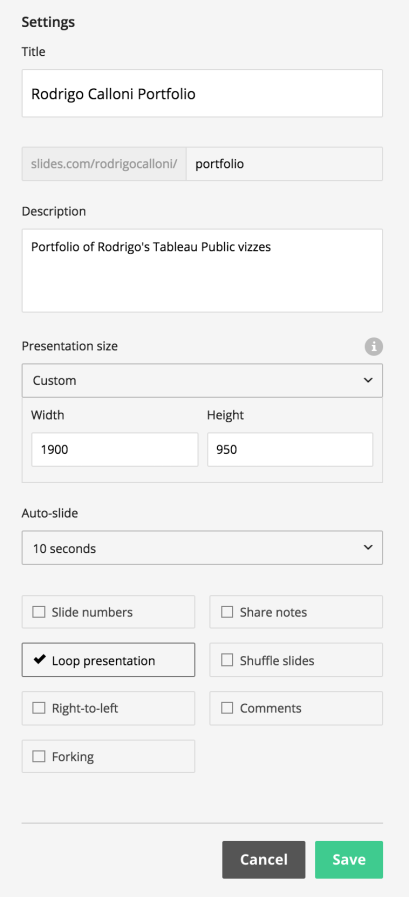
The first thing you should do is to click on the Settings icon. There you will define all you need to (1) make it fit on the right screen and also to set the slides to auto-play. Here is an example for my Tableau Public Portfolio:
Now it is the easiest part of the process, in the canvas, delete any text that is on the screen and drag-and-drop your first iframe component. In the top left you will have the option need to add the link to your workbook:

Note: in this moment try to replicate the dimensions of your viz into the iframe. Also center it both vertically and horizontally.
But… where is the viz? Due to security restrictions placed on Tableau Public it is not allowed to embed the viz in an iframe like this. But don’t worry, there is a way to fix for that. Ensure to add the &:showVizHome=no at the end of your viz link and, also, that the viz is on https:// (Thanks Jeff!)
Note: On my case, inside my organization, this wasn’t a problem as the x-frame options are more flexible for intranet pages.
Continue to add vizzes from your Tableau workbooks until you are done with the slides.
If you are inside your organization and the vizzes show just fine you can go straight to the green button on the left and start playing it. You can also get the “live” url that the system provides:

As you set the slides to auto-play in loop you are ready to place this on TVs or displays around the institution to reveal your vizzes.
If you prefer to host the file on your own intranet (and also to fix the issue with the x-frame) then you can easily export the html from slides.com menu:

If you added images to your slide deck please be aware that these images are hosted in slide.com. My recommendation is that you edit the html and localize all link to your images to the files on your computer/server.
Now open your slide deck and your vizzes will start to pop-up. The timer is set to 10 seconds (in my case) and every new slide will open a different viz from a different workbook.
And here are the slides (saved as a gif):

I hope this to be as helpful as it was for me 🙂
TIPS for Big Screen design:
- Your title must be size at least 60pt (I recommend 72pt)
- No important text should be below 20pt
- Your numbers should be at least 30 (I recommend 48pt)
- Make good use of white space so that people can have a pleasing experience consuming the data.
- Don’t rely on tooltips. Unless you have a fancy touch screen tv, nobody will be able to see the data hidden there.
- If you are displaying dashboard on a meeting room, take time to test your viz and go as far as you go from the TV and check if you still can quickly view the main insights.

Hi Rodrigo, thanks for sharing this. I am trying to follow your tutorial and I think they may have made some changes in the free version as I cannot find some of the options you mentioned in “slides.com” (sizing, etc, as well as “local download”)…I want to play around a little bit before going for the premium version, so will follow the link you shared and explore the dataduo deck. Any suggestions are welcome 🙂
LikeLike
Hi David… sorry for late reply. Lets talk on Twitter because I can see all these options on free version. I am happy to help.
LikeLike